The Weed Manager’s Guide To Remote Detection
- Home
- About us
- Detecting weeds
- Get involved
- Resources
Lookalikes and species phenological patterns
In any heterogeneous environment, it will be important to understand the botanical community in which the target species is found, in order to facilitate the accurate labelling of target species from lookalike species in resulting imagery. Plant features appear visually different as they grow and develop from season to season and in response to environmental conditions. These factors impact the representation of target species within an image and their subsequent detection accuracy.
Undertaking a survey of the existing plant species in the ROI prior to each capture (including from the same sites across the year) is the first step prior to flights taking place at each site. The existing plant survey provides a comprehensive understanding of which species will be represented in the imagery captured at that time for accurate labelling.
Species which are found in the landscape should be identified at an initial site visit, at the same time that the ROI is defined. The phenological growth pattern of each species (target and non-target) should be documented, including any changes that may occur in their appearance due to seasonal conditions. In addition, the most suitable time for image capture of the target species should be noted. This will be a time when the target is most distinguishable from surrounding vegetation or when it is most useful to identify it for control.
For most species, this will be flowering time or fruiting time, but some species can be identified when vegetative. Images of each species in the landscape should be documented for later reference during the labelling process. Labelling the target species within imagery for plants in vegetative stages is far more challenging due to the inability of our eyes to distinguish the different shades of vegetation.
Detection of weeds in vegetative stages typically requires the use of multispectral or hyperspectral sensors, which can delineate similar colours, i.e.,“green-on-green” as a result of their different spectral signatures. Please refer to the publications section, where success the detection of mouse ear hawkweed leaves has been achieved via the use of multispectral and hyperspectral sensors.
It is also very important to document carefully the lookalike species found in the environment, including their features and phenological development. These species will be the ones that lead to false positives in the imagery and so it will be important to clearly delineate these from the target species so as to facilitate accurate labelling and training of later detection models.
Defined areas for botanical assessment - Quadrats
Given that some ROIs are quite large, smaller defined areas within the ROI need to be marked out in the landscape (to be highly visible from the air for later identification within imagery). These areas are referred to as quadrats (described in the section on flight mission planning), the smaller areas that are assessed for botanical composition and features occurring at the time of imagery capture and will be used to facilitate imagery labelling and the stitching of imagery together for later analysis.
Botanical assessments within each marked area should include:
For small ROI (<500 m length/width) a minimum of ten quadrats will be suitable. For larger ROI, it is wise to add additional quadrats so that vegetation variability across the ROI can be captured. Including more quadrats will be beneficial for training later models.
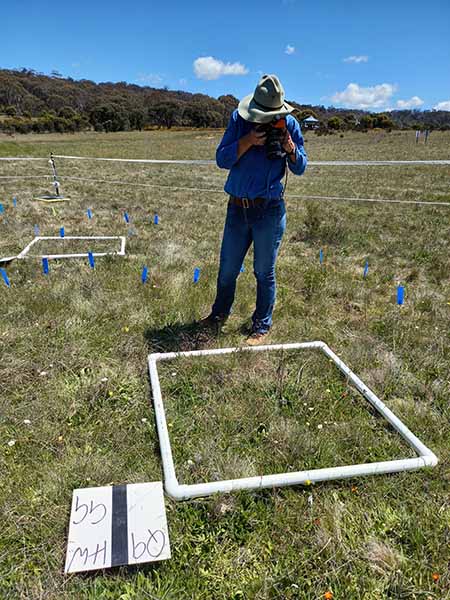
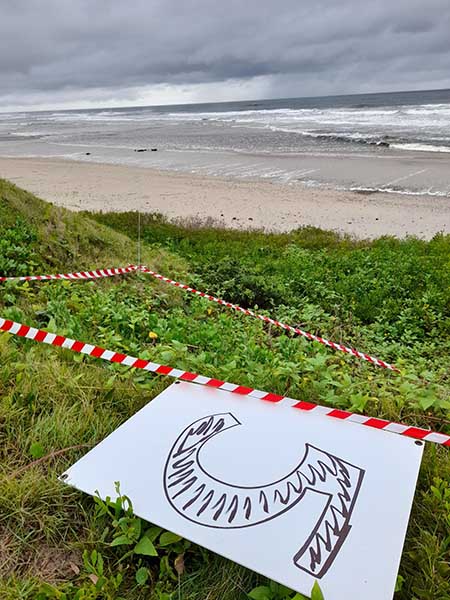
The size of the quadrats will be dependent on the target species. For small species like Hawkweed, 20 mm PVC plumbing pipe and elbows are highly suitable to make a 1 m x 1 m white quadrat (marking square indicator) that is easily distinguished from the air. For other species like bitou bush, which have a large growth habit and span a large area on the ground, coloured thick tape and pegs can be used to make the defined quadrat around the target species and associated vegetation.
These areas do not have to be large, but just large enough to contain target species and some neighbouring plants. They also do not have to be any particular shape, but should be labelled with a number written in large text that could be attached to the quadrats so that they can be referenced and seen from the air.
Simple white corflute sheets with thick numbers drawn on them and secured with more pegs at each quadrat within a ROI are suitable as quadrat identifiers. The position of the quadrats (via recording GPS coordinates) should also be recorded at each site, in order to provide reference points in the imagery for later analysis. This can be done using an accurate handheld GPS receiver, best achieved with sub-metre accuracy if possible.
An example of the quadrats used for hawkweed and bitou bush (plus label number “5”) are shown below:

Fig 1. PVC pipe used to make 1 m x 1 m quadrats for hawkweed detection. Source: Wendy Menz (NSW DPE).

Fig 2. Tape and pegs used to make larger quadrats for Bitou Bush detection. Source: Jane Kelly (Charles Sturt University)
Regardless of what is used to make the quadrats, they should be positioned at random across the ROI, ensuring that a mix of species found within the ROI is contained within some quadrats, while other positions should be chosen to contain pure stands of the target weed or no target species at all. This allows for a comprehensive representation of the botanical species observed across the ROI.
Note: this methodology is in contrast to the normal practice of using quadrat for Vegetation Survey and Assessment (VSA) where the quadrats are used for a plant count determination in assessment areas within a specific ROI. The methodology having variable botanical composition and variable levels of target weed presence is essential to the development of a robust system for detection.
Field- Labelling
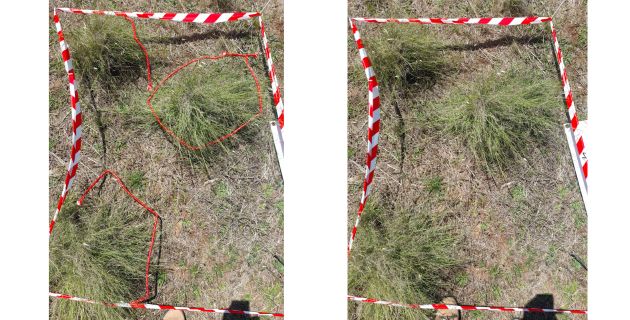
To assist later processing, the labelling of training images used to train AI algorithms can be made easier by identifying the target plants within the quadrats whilst in the field using small sections of rope, or a coloured marker, to delineate the border of the target species at the site. Likewise, lookalike species can be identified the same way within a quadrat using a different coloured marker also. This makes labelling much easier within the images later by validating which species are the species of interest whilst they can be clearly identified and confirmed in the field. Close up images of the quadrats can then be taken both with the markers/rope and without, to assist the labelling process. This is called “field-labelling”.

Fig. 1a. Rope showing “field labelling” Fig 1b. Absence of rope showing of African Lovegrass plants in field quadrat original plants in field quadrat.
A similar approach can consist of using coloured items to mark sparse individual weeds within quadrats. These can be captured at ground level with high-resolution smartphone cameras, and processed to locate each coloured dot within the quadrat. If quadrats can be aligned in the field at a set orientation (e.g. always aligned with North), one can map the accurate location of the quadrat corner with RTK surveying equipment and then automatically project the position of each plant within it. This process would assist in identifying plants individually and de-duplicating their imagery if using overlapping images or tiles. Fig 1 below shows an example of this process used to map Skeleton Weed in WA.
Fig.1. Schematic view of cm-precision mapping equipment used for ground truth of Skeleton Weed surveys in WA, and the resulting georeferenced image-tile index with plant annotations.